Blog·
Canopy cover vs. tree cover: what's the difference, and why planners keep mixing them up
If you've sat through a council meeting where someone cites "35% tree cover" and someone else cites "28% canopy cover" for the same city, you already know the problem. These terms get used as synonyms in budget memos and state-of-the-urban-forest reports, and they're not the same measurement. Getting the distinction wrong doesn't just confuse a presentation. It can make a planting-target program look like it's hitting numbers it isn't.
The actual difference
Tree cover usually refers to the presence of trees in an area, counted however the source counts them: a tree inventory, a parcel-level stocking estimate, sometimes just a tally of planted stock from a nursery program. It can include young saplings that haven't leafed out into anything yet.
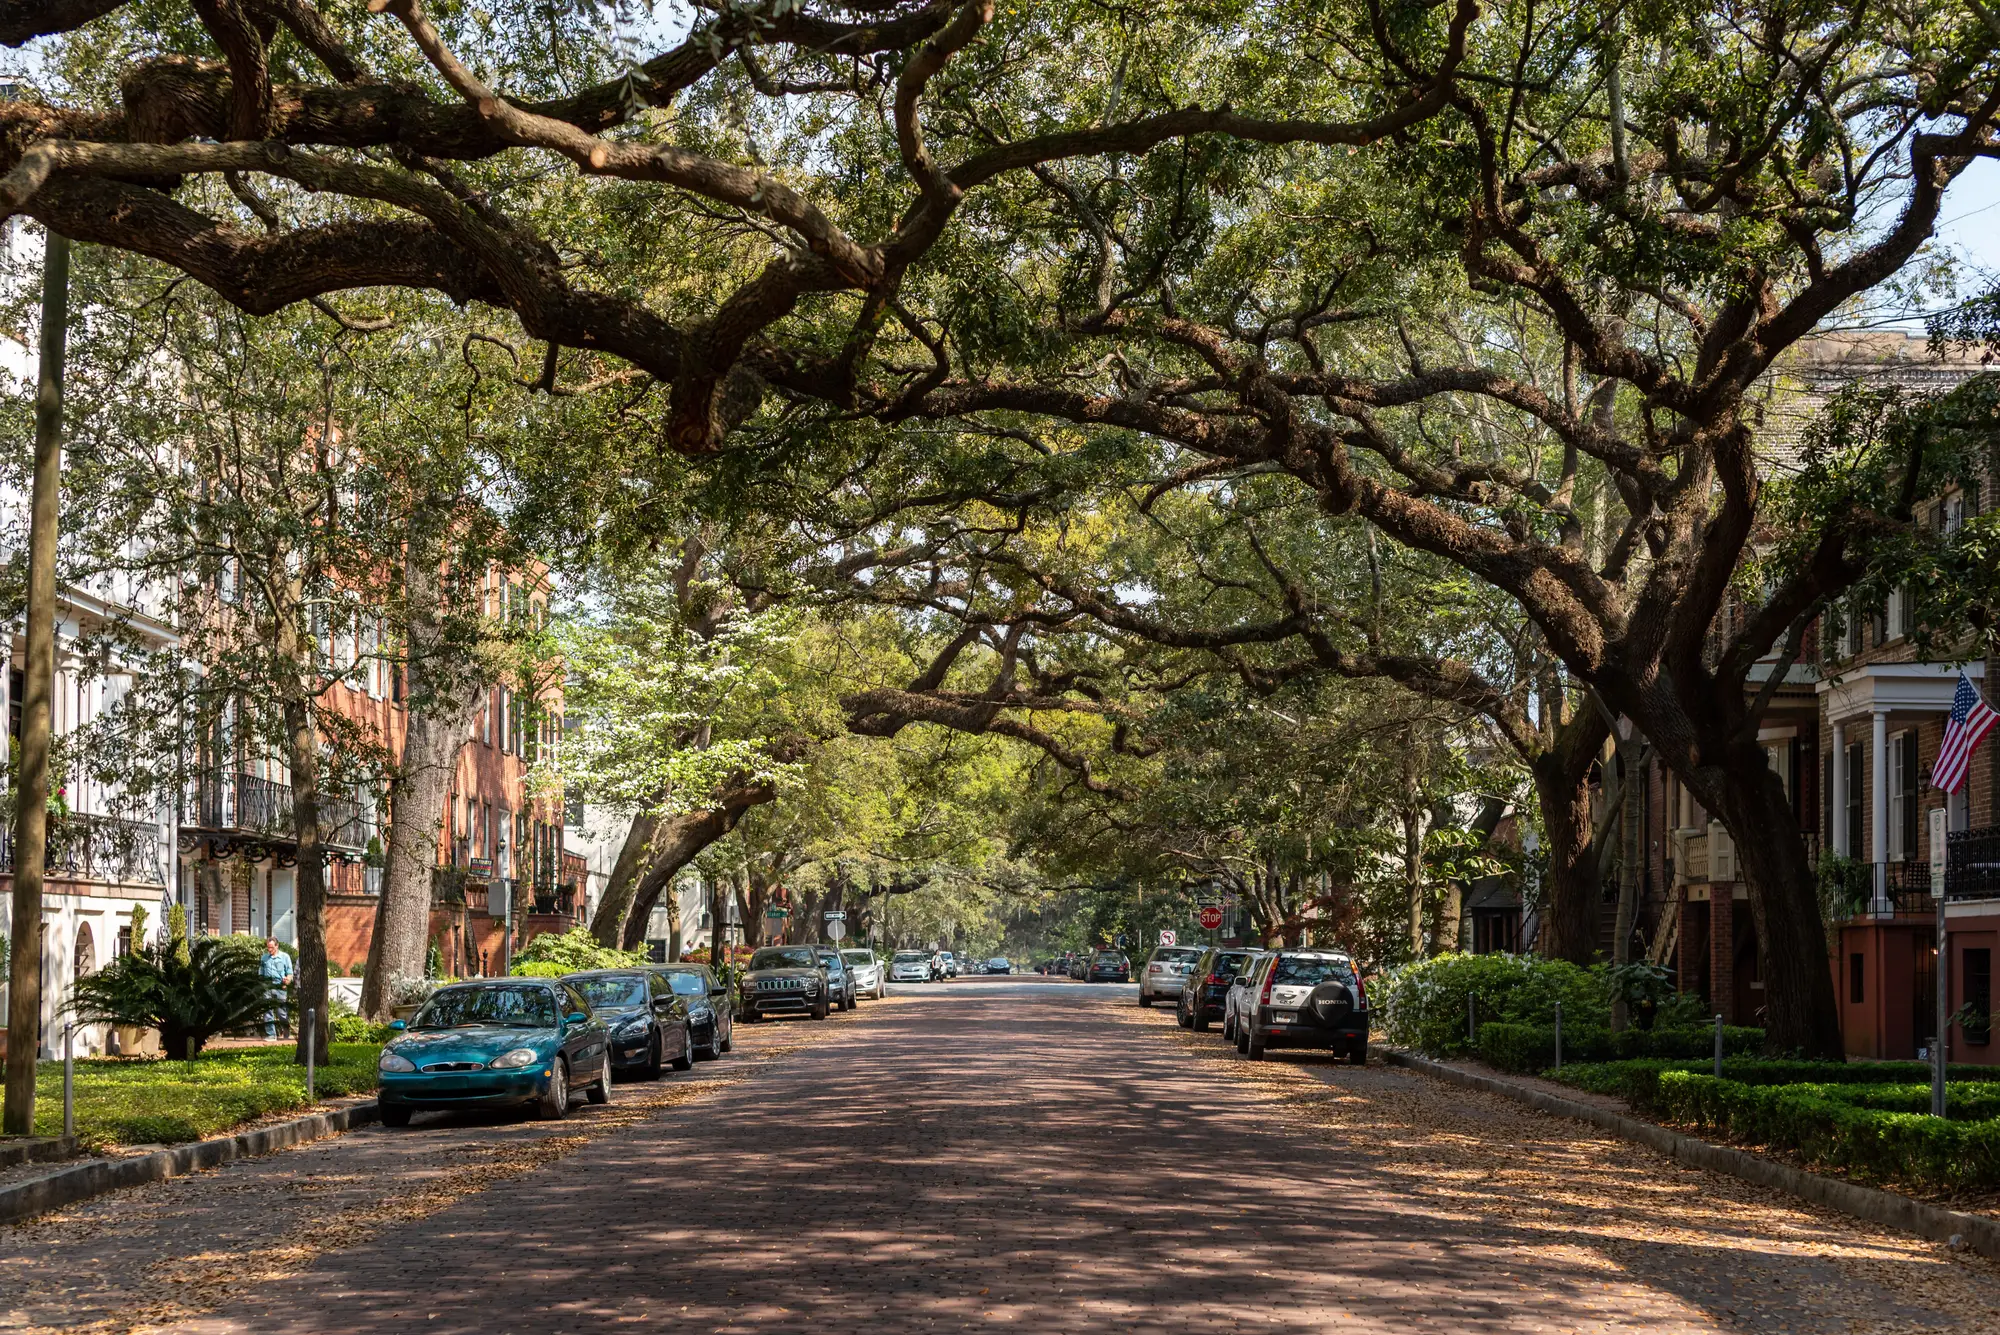
Canopy cover measures something narrower and more useful for tracking progress: the percentage of ground that tree crowns shade when viewed from above. A three-year-old street tree with a six-foot crown contributes almost nothing to canopy cover. A mature oak with a forty-foot spread contributes a lot, even if it's the only tree on the block. This is the number urban forestry programs report against planting targets, because it reflects shade, stormwater interception, and heat mitigation, the things a canopy goal is meant to produce.
The confusion happens because both terms get shortened to "cover" in casual use, and because older assessment methods (windshield surveys, hand-digitized aerial photos) often didn't distinguish crown overlap from tree count in the first place. A block with twelve small trees can report high "tree cover" by count while sitting at single-digit canopy cover by area. Those are different facts, and a planting-target program needs the second one, not the first.
Why this matters at the block level
Citywide averages paper over the gap. A department might report 30% canopy cover and feel good about it, while half the city's blocks sit under 15% and the other half sit over 45%. That's the pattern that predicts where heat complaints, stormwater overflow, and canopy-equity gaps show up. A planting-target program built on the citywide number alone will keep planting in neighborhoods that already have cover, because that's where staff happen to be working, not because that's where the gap is.
This is also where a one-off consultant survey falls short even when it gets the canopy-versus-tree-cover distinction right. A survey done once gives you a snapshot. It tells you where the gaps were the year it was flown. It doesn't tell you whether the blocks you planted three budget cycles ago closed the gap, because by the time you'd notice a problem, the survey is five years stale and the next one isn't funded yet.
A block-level canopy layer, rebuilt on a cadence rather than commissioned once, answers both questions at the same time: where is cover thinnest right now, and did the blocks you planted two assessment cycles ago move the percentage. Urban Tree Canopy builds that layer from VHR RGB and NIR imagery, refreshed every two years, delivered as a block-level map plus a summary percentage-cover table, so the department is tracking shade on the ground rather than tree counts in a spreadsheet.
A quick way to check which number you're looking at
If a report gives you a single citywide percentage with no block breakdown, ask whether it's counting trees or measuring crown area, and ask how old the underlying imagery is. If it can't answer either question, treat it as a snapshot, not a tracking tool. A planting-target program that reports on canopy cover, broken out block by block, on a cadence short enough to catch problems before the next budget cycle, is reporting on the thing the targets were set to measure in the first place.
If your department is still arguing about which percentage to put in the annual report, it's worth seeing what a block-level canopy layer actually looks like for your city.