- To
- City forestry planner
- From
- Urban Tree Canopy
- Re
- Canopy cover for every block in the city
- Cycle
- Biennial, matched to the program review
See canopy cover block by block, not as one citywide number.
An inventory built for planting targets. Every block gets its own percent canopy, redone every two years, so you can see which blocks are still thin.
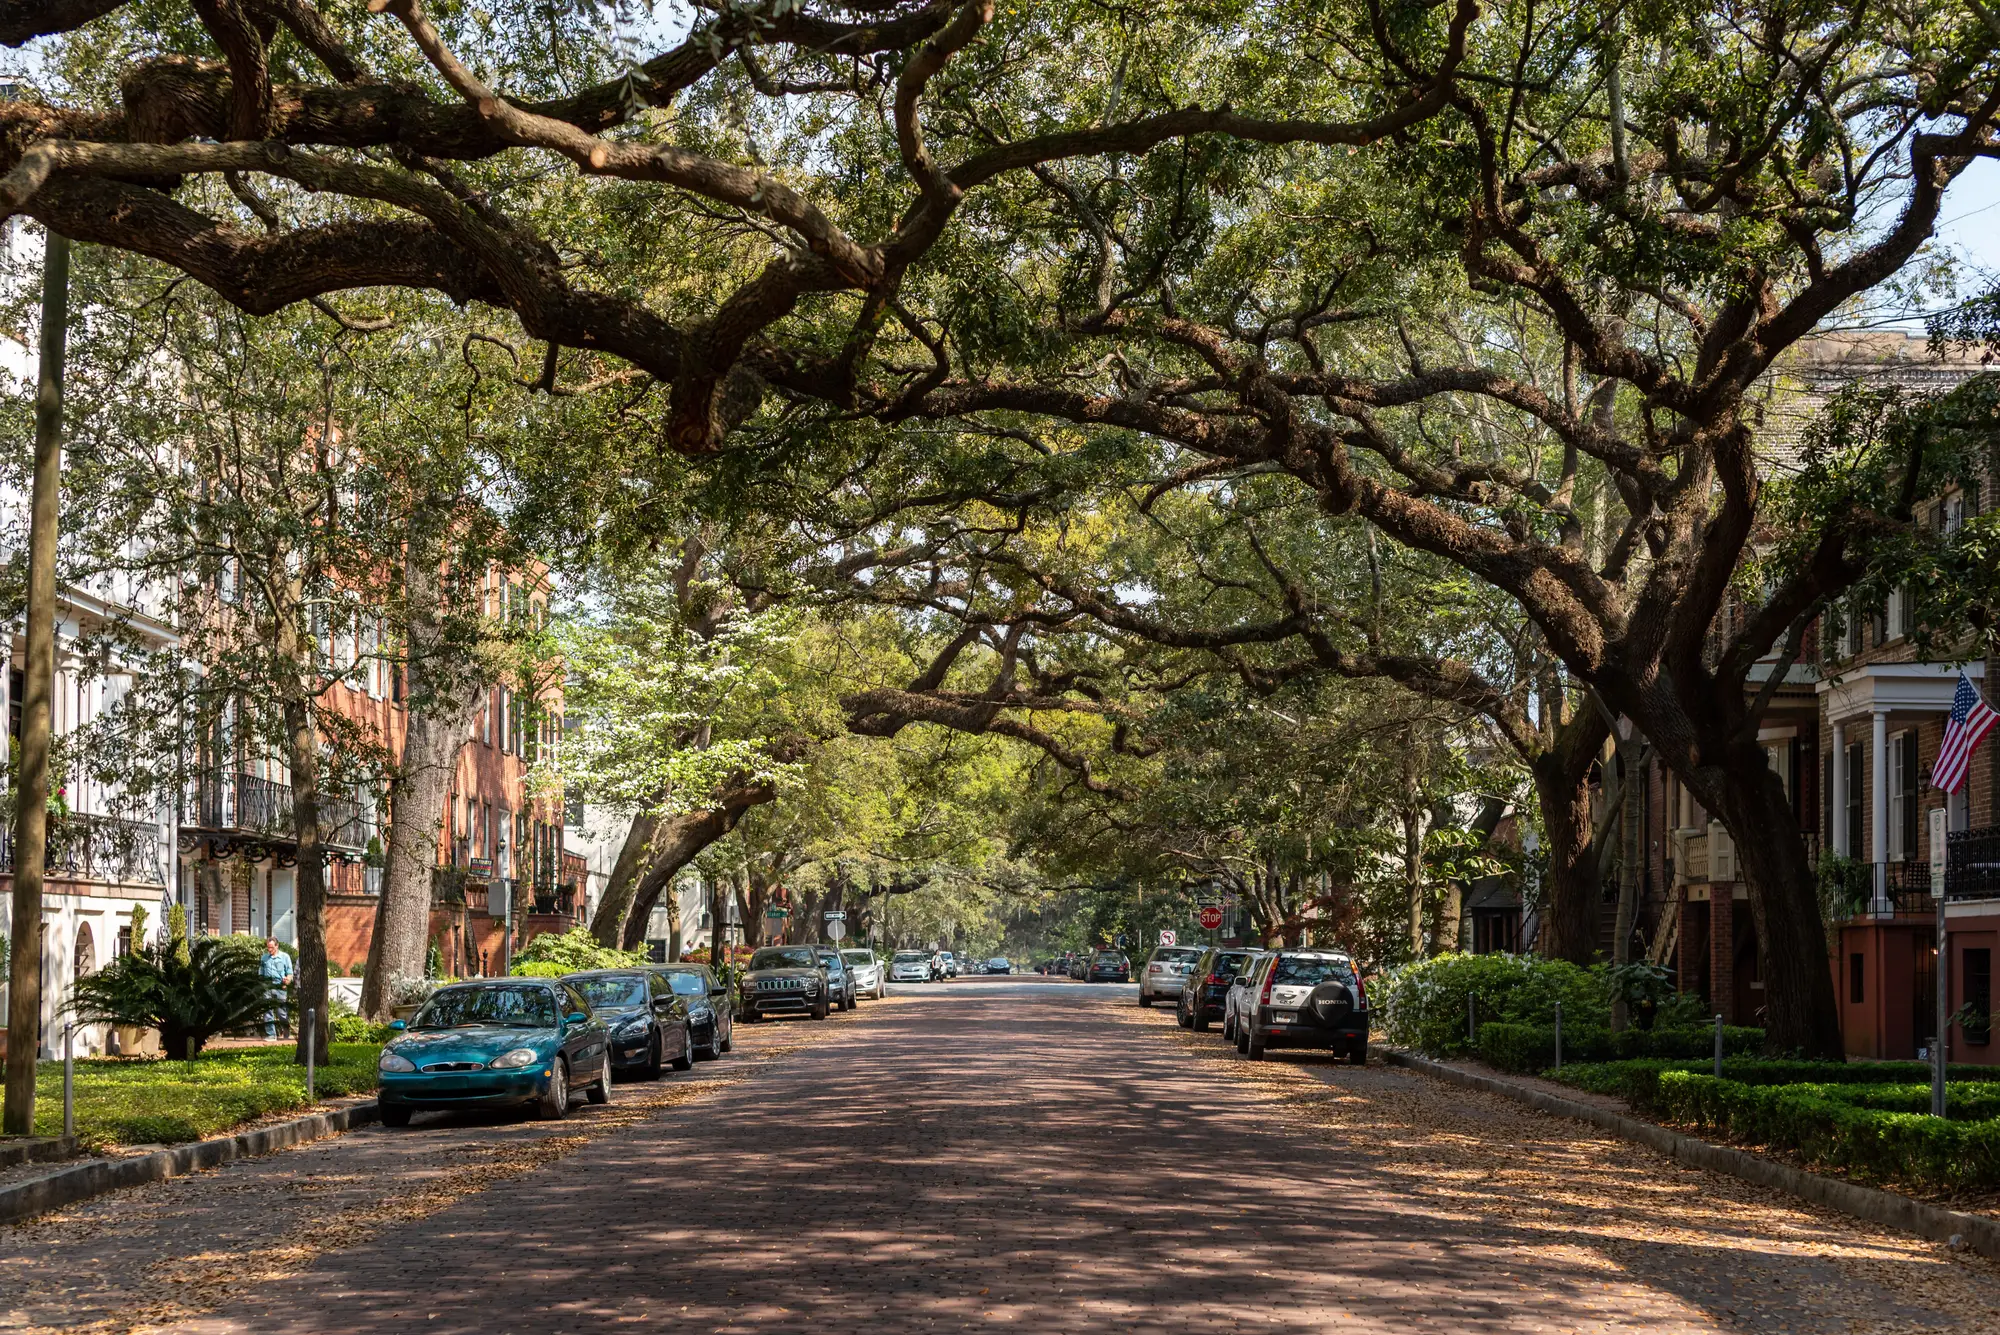
How canopy progress gets reported now
Often a forestry department has one canopy figure, and it came from a consultant. Someone classified land cover for the whole city, wrote it up, and gave the department a percentage for the city and maybe a map. That report has been the reference for the planting-target program ever since. When the program review comes round, the planner takes the same percentage, or an old one nudged by the trees the department knows it has planted, and puts it in the progress report.
It works until somebody asks a block-level question. Council wants to know which neighborhoods are furthest from the goal. The sustainability office wants the equity analysis. A district council member asks why her streets have so few trees and what is planned. The citywide average can't answer any of them, because a leafy park district and a paved-over industrial corridor average out to a respectable figure, and the thin blocks vanish in the middle. The planner ends up choosing planting neighborhoods from the street tree inventory, complaint calls and knowledge of the ground, which covers public trees and says nothing about the canopy over private lots.
The survey is also a one-time purchase. By the time a planting cycle is finished, the baseline is out of date and nobody can say whether the cover moved. This offer puts a fresh block-level measurement on the program's own review cycle, every two years, so progress against the target comes from the same method each time.
What arrives each cycle
2.1Block-level canopy layerGeoJSON or Shapefile
One polygon per block for the whole city, each carrying its percent canopy. It opens in ArcGIS or QGIS and joins to your own neighborhood, district and equity layers. It is delivered once per survey cycle.1
2.2Summary cover tableTable
Percent canopy by block, and rolled up by district, in a form that pastes into the progress report and the urban forest master plan. Sort it by cover to see the thinnest blocks first.
2.3Biennial refreshEvery two years
The same method run again on the program's review cycle, so the second survey lines up against the first. Each refresh shows whether a block gained or lost cover against the last one, which is how you report progress against the target.2
How it works
3.1Boundary and blocks
You send the city boundary and, if you have one, the block or block-group layer you report by. If you don't, we agree the block grid with you first. Everything later is reported on that grid.
3.2Imagery
We take a citywide very-high-resolution pass with RGB and near-infrared bands, timed to the leaf-on season.34
3.3Classification
Canopy is told apart from grass, shrub and sealed ground using the spectral signal, then counted per block.5
3.4Delivery
The block layer and the cover table come back. The next cycle reuses the same grid, so the two can be compared directly.
Where it fits in your workflow
Between the survey and the planting list
Use the first cycle as the baseline inventory. Sort the cover table, pick the blocks furthest below the target, and lay them against your equity and heat layers to choose where planting goes next. Crews still work from the street tree inventory and site visits to decide which trees and which curb strips. Two years on, the refresh shows whether those blocks moved, and that goes into the progress report for council.
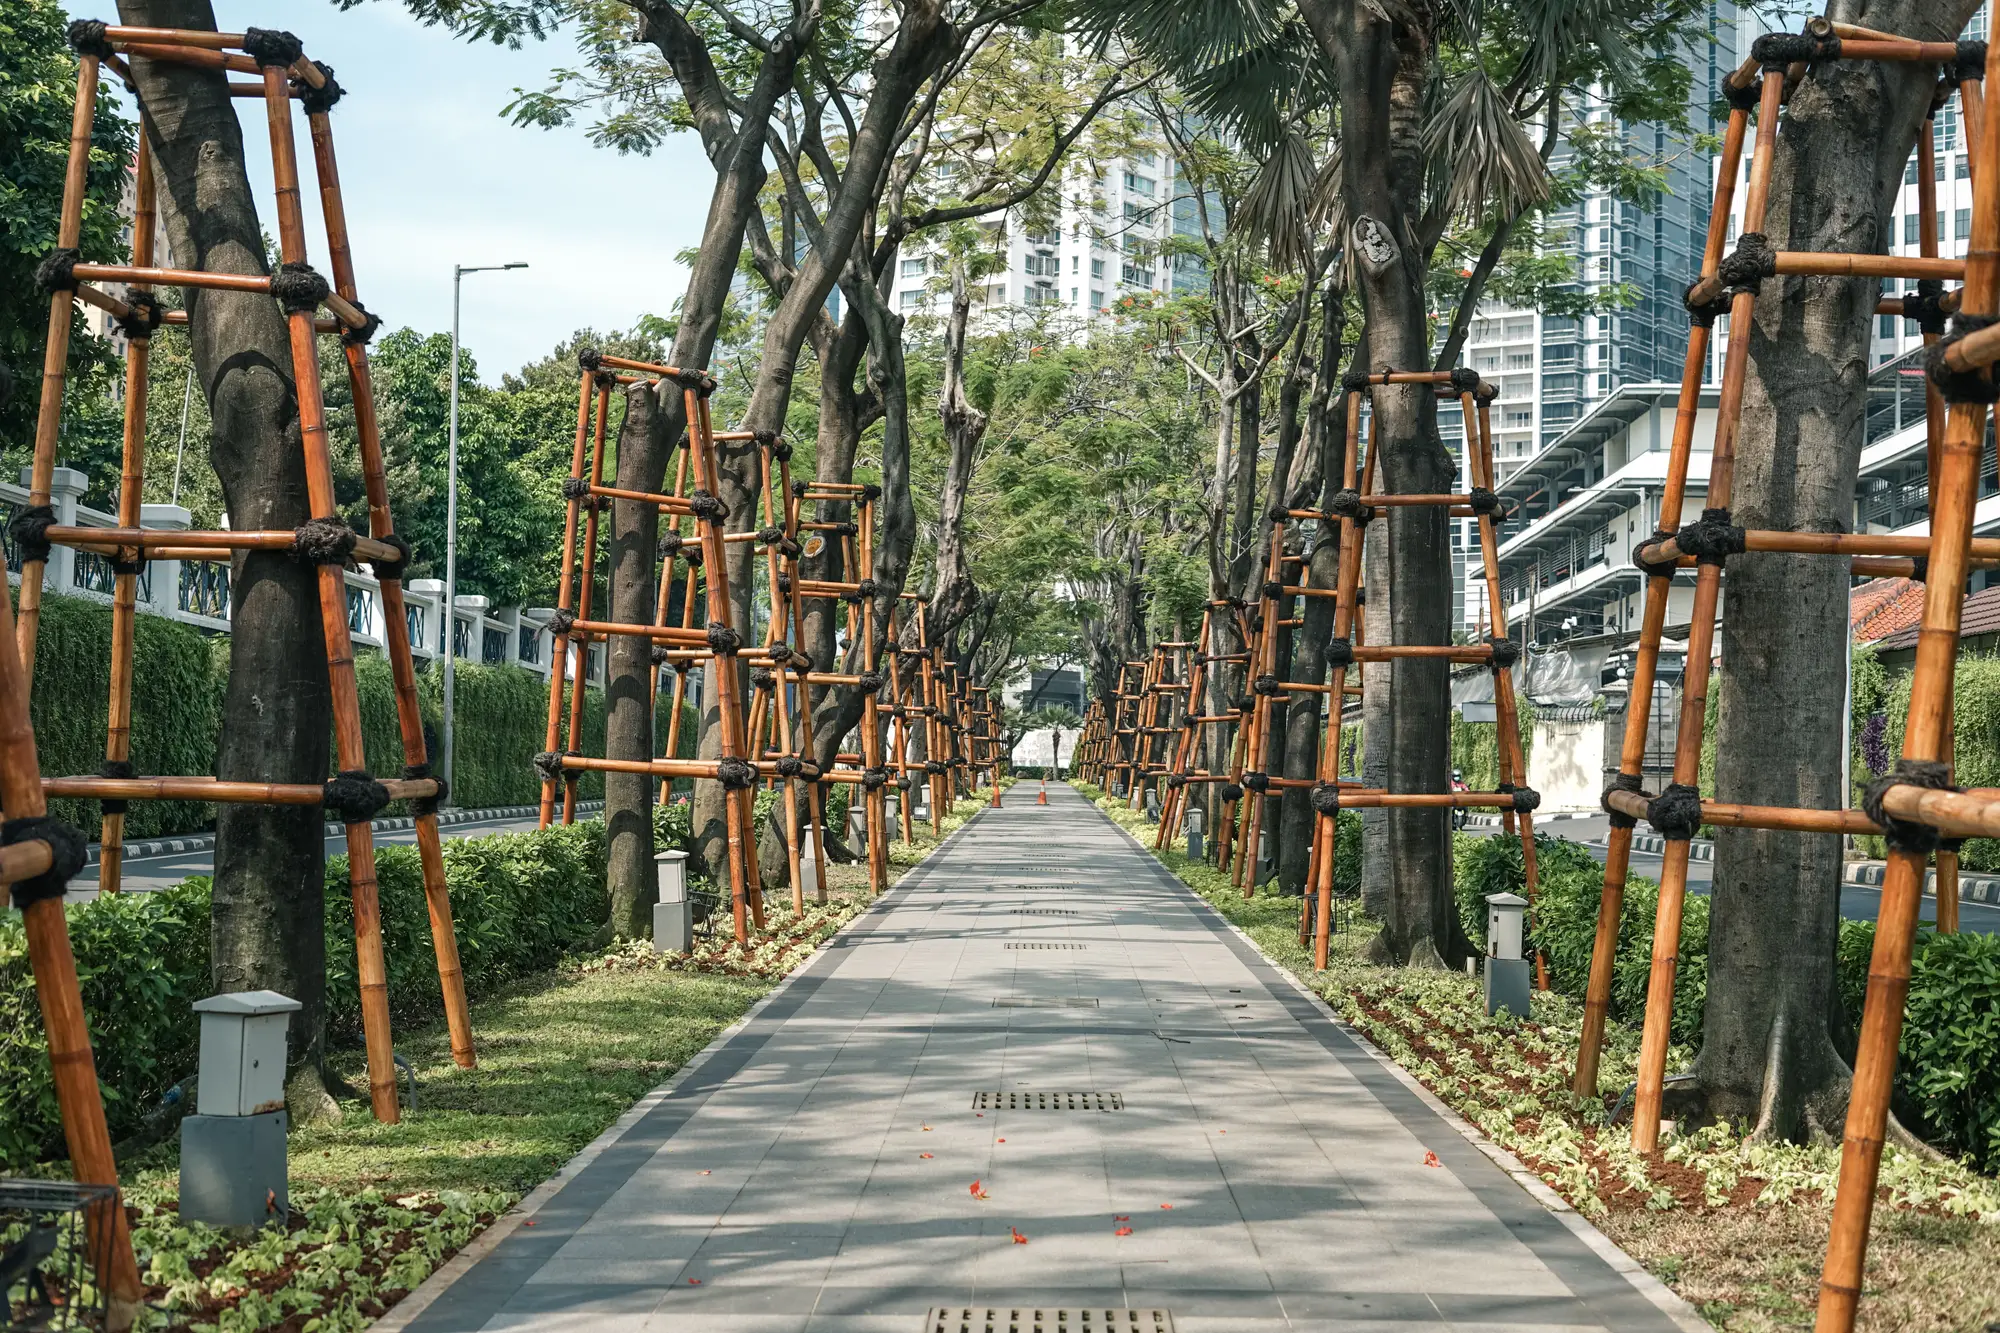
The layer says how much canopy sits over a block, public and private. It does not say who owns the trees. A block that looks thin can be thin because it is mostly pavement, and the planner knows which of those can take a tree.6
Limits
- 1
Cover, not trees
The inventory measures how much ground is shaded by crowns. It counts no individual trees and identifies no species, age or health. The street tree inventory and arborist assessment stay the record for individual trees.
- 2
Every two years
One full pass each cycle. A planting done the season after a survey shows up in the next one. There is no monthly or annual update, and a young tree adds almost nothing to cover for some years.
- 3
Resolution floor
At 0.5 m a pixel is narrower than a mature street tree crown, so crowns and stands are resolved. A single young sapling or a clipped hedge is not. Planting you did last season may not register yet.
- 4
Clear-sky window
Optical imagery needs clear skies. Persistent cloud over the city during the capture window can delay a cycle's update.
- 5
Edges of a block
Canopy is told apart from other vegetation by its spectral signal, and that call is imperfect at the edge of a crown, in a shrubby lot and where canopy overhangs a block line. Expect edge blocks to carry more uncertainty than the middle of a large canopy.
- 6
Not a ground survey
This does not replace a ground survey, an arborist's assessment or the street tree inventory. It is a remote, block-level measurement of cover.
Who it's for
For
- City forestry planners running a planting-target program who need canopy by block
- Urban forestry and parks staff preparing the canopy progress report or the urban forest master plan
- Planning and sustainability staff doing tree equity or heat-context analysis on block geography
Not for
- Anyone needing species, age, health or condition of individual trees
- Tree-by-tree maintenance, risk or pruning work
- Rural forest or timber inventory
- A one-number rating or certification of a city's greenness
Questions before you start
Does this replace a ground survey?
No. It measures cover from above, block by block. Ground survey and arborist work still cover individual trees, species and condition.
How is canopy told apart from grass and shrubs?
By the spectral signal in the red, green, blue and near-infrared bands, which differs between tree crowns and lower vegetation. The call is imperfect at block edges and in shrubby lots.
Can it tell me species or tree health?
No. It measures cover extent only.
Does cloud affect the inventory?
Yes. Persistent cloud during the capture window can push that cycle's update later.
How often is it refreshed?
Every two years, matched to a typical program review cycle.
How do we check it against our own data?
Pick a few blocks your staff know well, including thin ones and leafy ones, and compare the percent canopy with what you see on the ground and in your own imagery. Decide from that whether the layer is good enough to plan with.
Will it load into our GIS?
It comes as GeoJSON or Shapefile plus a table, so anything that reads a GIS layer or a spreadsheet can take it. We don't write into your systems directly.
Who owns the results and the imagery?
Ownership and licence terms for the deliverables and the imagery are set out in the agreement before anything is ordered. If your city attorney needs to review them, ask early.
How is it bought and priced?
We scope and quote it for your boundary. Tell us how your department buys professional services and we'll fit the scope to that.
Get a baseline before the next program review.
Tell us your city boundary and when your next canopy progress report is due. We'll say whether the imagery calendar can meet it.