Blog·
Street trees vs. park trees: two different lines in your canopy count
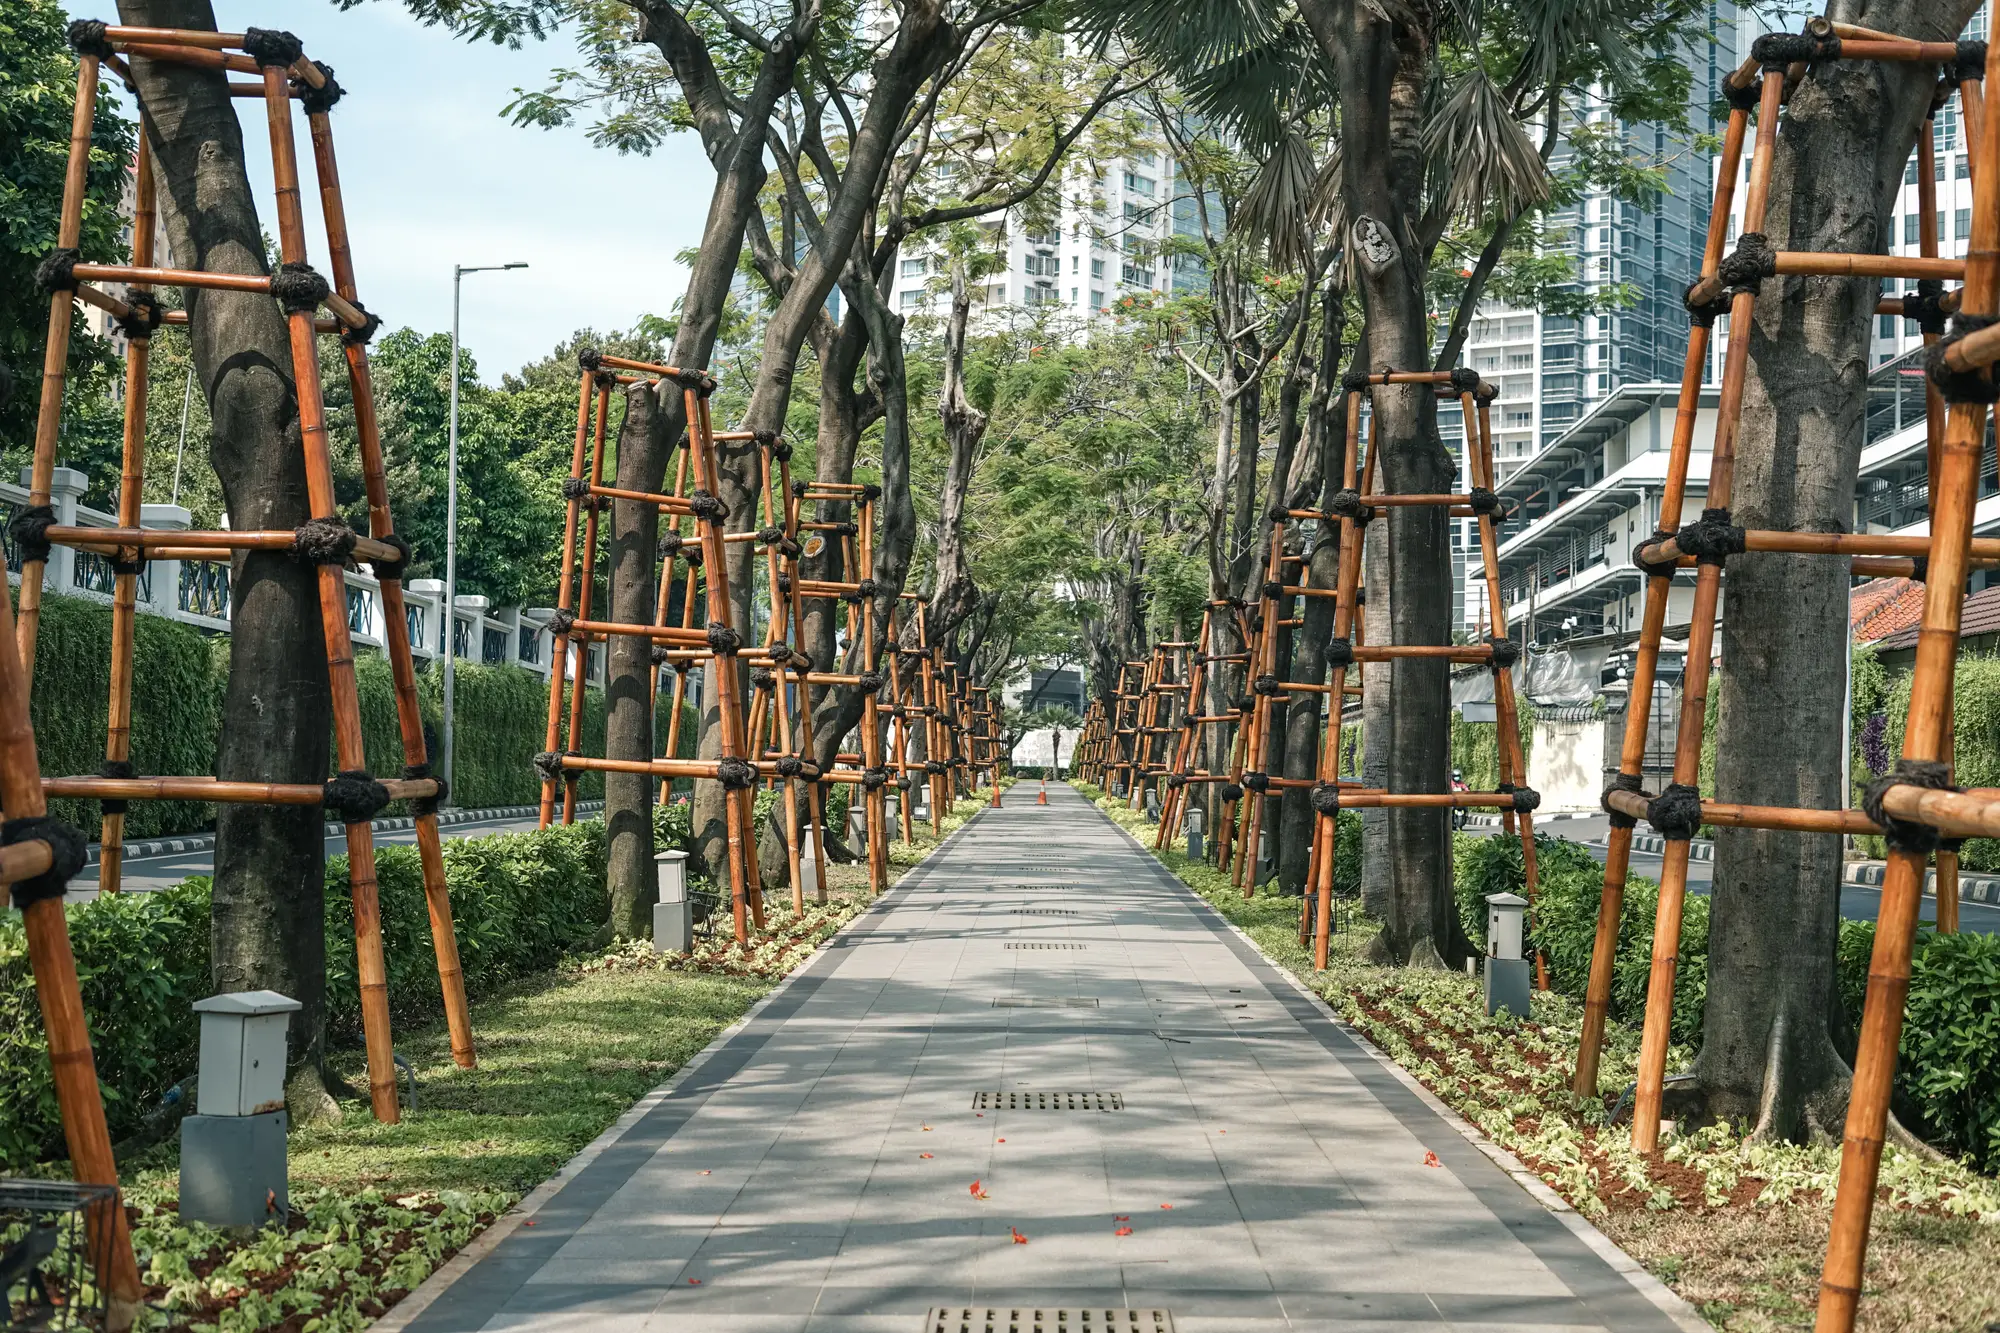
Every forestry department has had this conversation: the annual canopy number comes in at, say, 28%, and someone on council asks why it hasn't moved despite three years of planting along arterial corridors. The answer is usually that the citywide percentage is doing something your planting program never asked it to do. It's averaging two completely different kinds of canopy together.
Why street and park canopy get counted as one thing
Most canopy assessments start from a land cover classification: an image gets sorted into tree canopy, grass, pavement, buildings, water, and so on. That classification doesn't know or care who owns the tree, or what it's growing in. A 200-year-old oak in the park and a three-year-old honeylocust in a tree pit on Main Street both just register as "canopy." Add up the pixels, divide by city area, and you get one number. It's a real number, but it's a blend.
That's fine for a state-of-the-urban-forest report that just wants a headline figure. It's a problem for a planting-target program, because the program isn't trying to move park canopy. It's trying to move the canopy over streets, sidewalks, and parking lots, the land where your crews have planting strips to work with.
What's different between the two
Park canopy tends to sit in large, contiguous patches. It's often already mature, already closed-canopy in the interior, and in a lot of cities, already near whatever capacity the park parcel can hold. Short of removing pavement or structures, there isn't a lot of new planting area left inside an established park.
Right-of-way canopy is the opposite shape: thin ribbons along curb lines, individual tree pits, medians, and the narrow strip between sidewalk and property line. Driveways, utility vaults, and overhead lines fragment it, the growing environment is rougher, and mortality in the first five years runs much higher. Most of the planting capacity sits here too, because that's where the empty tree pits and bare strips are.
When you blend the two into one citywide percentage, a few large, canopy-rich parks can carry the number even while whole blocks of row housing have almost nothing over the sidewalk. The average looks healthy. The street grid doesn't.
Why this matters for a planting-target program specifically
If your program tracks something like "percent canopy on designated arterial corridors" or "trees planted per linear foot of right-of-way," the citywide figure isn't the right denominator. A planting season that puts three hundred trees into tree pits downtown can be invisible in a citywide average that's dominated by an 80-acre regional park on the other side of town. Conversely, if a storm takes down a stand of mature trees in that same park, the citywide number can drop in a way that has nothing to do with your right-of-way work and everything to do with park maintenance.
Tracking at the block level is the way around this. A block-level canopy layer lets you pull out blocks that are mostly park or open space and look at the remaining residential and commercial blocks on their own terms, crediting the program for the canopy it controls on those blocks.
Separating the two in your own reporting
In practice, most departments handle this by tagging blocks (or parcels) by predominant land use before running the percentage. Park and open-space parcels get pulled into their own summary line. Everything else, mostly right-of-way frontage and private yard trees along the street, becomes the figure that answers "is the planting program working." It's worth keeping both numbers in the report rather than picking one: council usually wants the citywide headline, but your planting targets should be measured against the number that moves when your crews plant.
A block-level layer refreshed on a regular cadence makes that split something you can check every cycle instead of recomputing from a one-off survey. If your program is ready to stop arguing with a blended average, Urban Tree Canopy is built to track canopy by block so the right-of-way side of that number finally shows its own progress.