Blog·
How to set a tree canopy planting target for city council
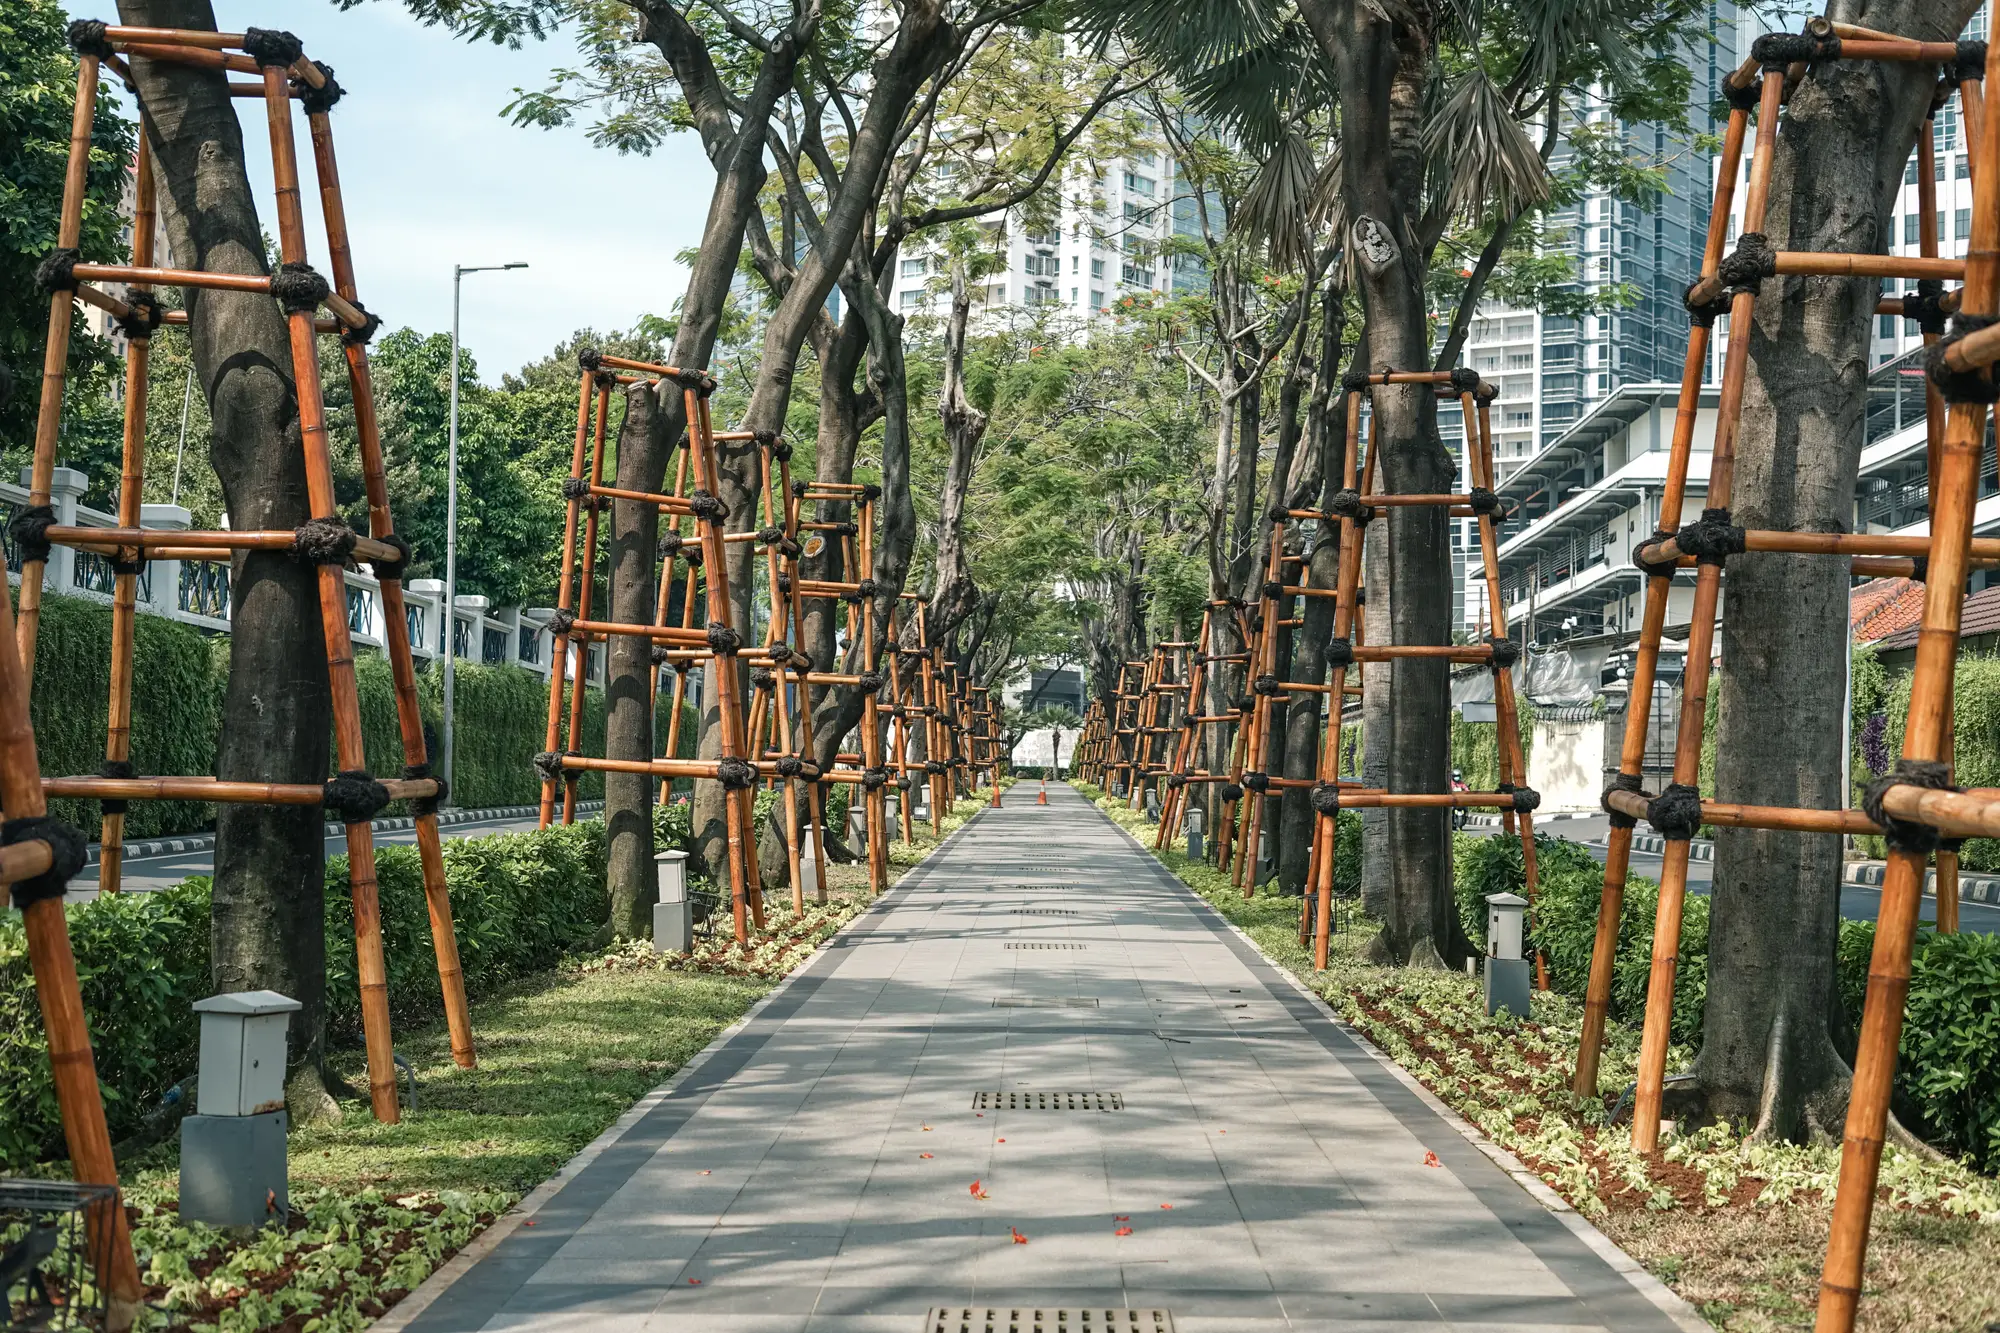
Most canopy targets start the same way. Someone on council, or a sustainability plan consultant, proposes a round number like 30% or 40% citywide cover by some future year, and staff get asked to make it happen. The number usually comes from a peer-city comparison or a regional climate plan, a figure borrowed from somewhere else rather than measured on your own city's blocks. That's a hard position to defend when a council member asks why the target is 40% and not 35%, or why the industrial corridor gets the same goal as the tree-lined blocks near the river.
A target holds up better when it's built backward from a baseline, phased by neighborhood, and written with a built-in way to check progress. Here's how forestry staff who've been through an ordinance fight approach it.
Start with what you have, block by block
Before you propose a goal percentage, you need a current canopy number you trust, not just a citywide average. A citywide figure of 28% can hide a downtown core sitting at 8% and a legacy residential district at 45%. Council members from the low-canopy wards will ask about their blocks specifically, and "the city average is 28%" doesn't answer that question. Pull the block-level breakdown first. It tells you where the gap is, which matters more for budgeting than the citywide headline number.
This also protects the target from a common failure mode: hitting the citywide average by planting heavily in parks and medians while residential blocks with the thinnest cover stay thin. A target without a block-level floor lets that happen and still counts as a win on paper.
Set the number, then set the gap it has to close
Once you have a defensible baseline, the target itself is a smaller decision than people expect. Most ordinances land on one of three approaches: a single citywide percentage, a percentage with equity carve-outs for historically under-canopied districts, or a tiered target by land-use zone, with denser goals for residential and lighter ones for industrial. The second option tends to survive council debate better, because it gives members a concrete answer for their own district instead of a citywide abstraction.
Whatever number you land on, pair it with a timeline long enough to be realistic. Canopy doesn't move fast. A newly planted street tree takes years to contribute meaningful cover, and mortality in the first three years can run high depending on species and maintenance capacity. A 10 to 20 year horizon with interim checkpoints, say every 2 years, matched to when you'd re-survey, gives council something to measure without expecting results on a budget-cycle timeline.
Write the ordinance so it survives a change in council
The target itself is only half the document. The part that gets implemented is the tracking mechanism written into the ordinance language: who reports progress, how often, and against what baseline. Ordinances that just state a percentage goal with no reporting clause tend to lose budget priority after the next election, because no one is required to produce a number. Ordinances that require a public report every two years against the original baseline tend to stick, because staff have to produce the number whether or not anyone remembers to ask.
That reporting clause is also where the block-level view earns its keep again. A two-year report that shows the same three districts still below target, year after year, is a much stronger case for the next planting budget than a single citywide percentage moving up by a point.
Keep the baseline consistent year over year
One quiet way targets fall apart: the baseline survey method changes between reports. If year one used a consultant's one-off aerial survey and year three used a different vendor with a different resolution or classification method, the two numbers aren't really comparable, and council will notice the inconsistency before staff do. Urban Tree Canopy builds the block-level canopy layer and percentage-cover table from the same VHR imagery pipeline on a biennial cadence, so the number you report in year three is measured the same way as the one you reported at baseline.
If you're drafting the data section of a planting-target ordinance and want a canopy layer that holds up across multiple council reports, see what Urban Tree Canopy tracks at the block level.