Blog·
Setting a block-level canopy baseline before your planting program starts
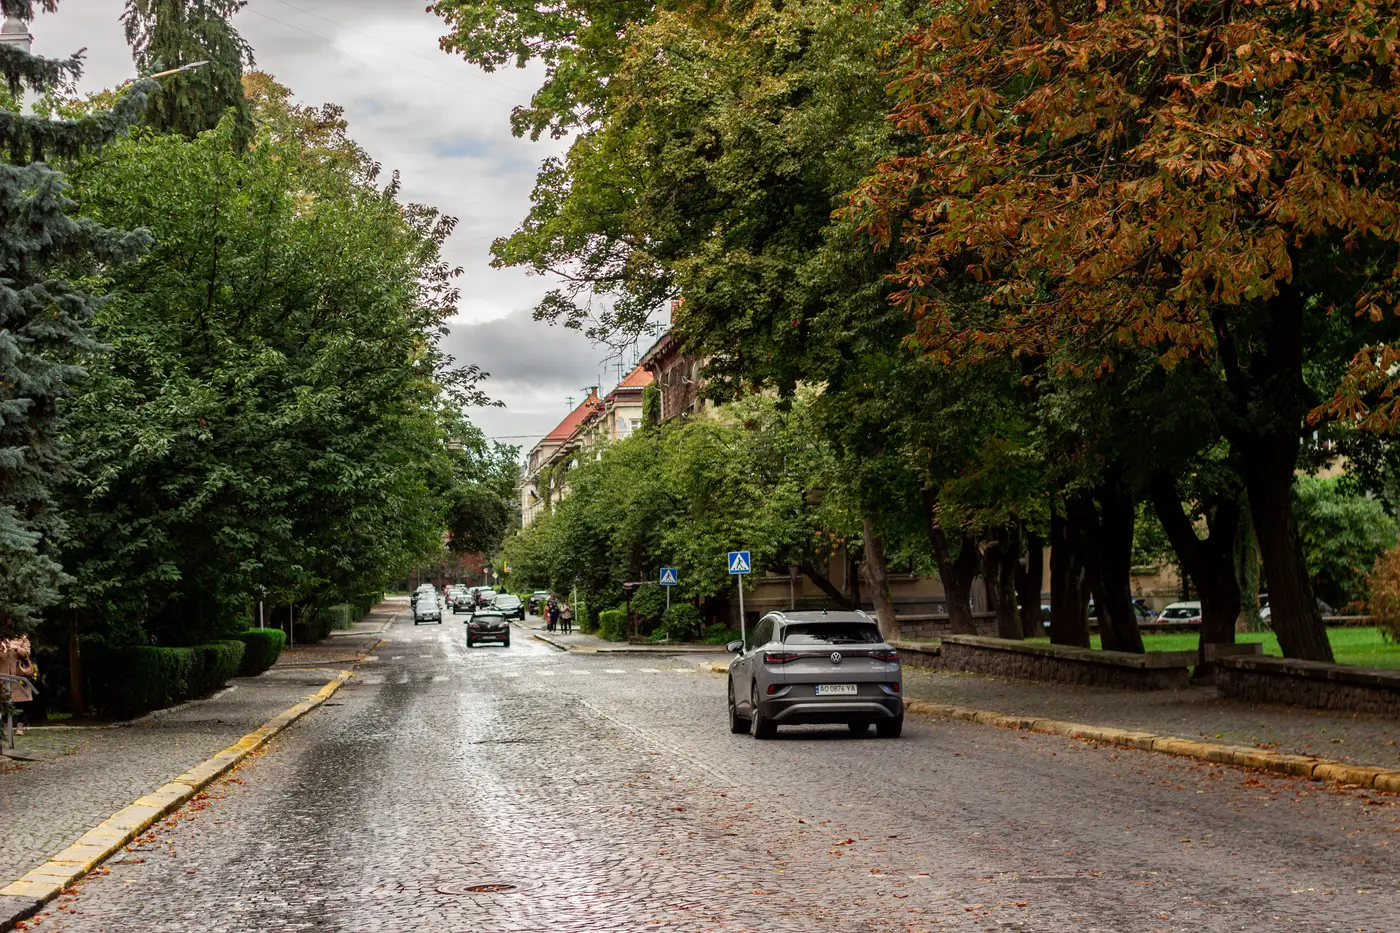
Before a planting program gets its first budget line, somebody has to answer a basic question: where does the canopy stand today, block by block? Get that wrong and the year-two, year-four, and year-six comparisons in every grant report and council briefing are measured against a number nobody can defend.
A lot of departments skip this step or do it badly. They pull a citywide average off an old land-cover dataset, round it to the nearest percent, and call it a baseline. Then three years into the program, a council member asks why the east side still looks bare on the ground despite the "progress" in the annual report. The citywide number was fine. The block-level reality wasn't.
Why the baseline has to live at the block level
Planting targets get set at the city level, but trees get planted on specific blocks, in specific rights-of-way, around specific tree wells. If your baseline only exists as a single percentage for the whole jurisdiction, you have no way to tell which blocks are gaining cover and which ones are just along for the ride in the average.
A block-level baseline does three things a citywide number can't. It shows you where cover is thinnest right now, which is usually where a planting program needs to start. It gives each council district or neighborhood its own starting line, so equity-driven targets (the kind tied to heat vulnerability or tree-equity scoring) can actually be tracked instead of asserted. And it gives you a defensible denominator for every "we added X% canopy" claim that goes into a grant report or a council briefing two years from now.
What a real baseline needs to include
A usable baseline pairs a canopy layer that someone can overlay on a block or parcel grid with a summary table that rolls that layer up to whatever unit you report against: council district, planning area, census block group, whatever your program uses.
Getting a layer accurate enough to hold up at that scale takes imagery with a ground sample distance fine enough to separate street trees from lawn and roof shadow, finer than the coarse land-cover rasters built for regional-scale work. Near-infrared bands help separate healthy canopy from turf and bare ground in a way plain RGB imagery tends to blur, especially under spring green-up or fall color change. Very high resolution satellite or aerial capture, at half a meter or finer, with RGB plus NIR, is the baseline for calling something a baseline at all.
Setting the clock before the first tree goes in the ground
The timing matters almost as much as the resolution. Capture the baseline before planting starts, not after the first season's trees are already in. If your first measurement happens after new plantings are in the ground, you've baked year-one growth into what's supposed to be the "before" picture, and every future comparison is quietly off.
From there, the program needs a fixed re-measurement interval, something a biennial canopy survey gives you, so a council member or a grant auditor can ask "where were we in year one versus year three" and get an answer that was captured the same way both times. Changing methods between measurements (a satellite pass one year, a consultant's windshield survey the next) breaks the comparison even if each individual number looks reasonable on its own.
A common mistake worth naming
Departments often treat the baseline as a one-time deliverable: a consultant hands over a PDF, the number goes in a grant application, and nobody touches it again until someone asks for an update five years later. By then the imagery is outdated, the methodology is undocumented, and you're starting over, not updating. Treat the baseline as the first point in a recurring series from day one, and the planting program gets a track record instead of a single snapshot that ages out of relevance.
If you're setting that baseline now, Urban Tree Canopy builds the block-level layer and the percentage-cover table from the same imagery and cadence you'll use for every re-measurement after it. Get in touch and we'll walk through what a baseline looks like for your jurisdiction.